About Zomato
Zomato is an Indian restaurant aggregator and food delivery start-up founded by Deepinder Goyal and Pankaj Chaddah in 2008. Zomato provides information, menus and user-reviews of restaurants, and also has food delivery options from partner restaurants in select cities.
About Our Project
India is quite famous for its diverse multi cuisine available in a large number of restaurants and hotel resorts, which is reminiscent of unity in diversity. Restaurant business in India is always evolving. More Indians are warming up to the idea of eating restaurant food whether by dining outside or getting food delivered. The growing number of restaurants in every state of India has been a motivation to inspect the data to get some insights, interesting facts and figures about the Indian food industry in each city. So, this project focuses on analysing the Zomato restaurant data for each city in India.
The Project focuses on Customers and Company, we have analyzed the data and made some useful conclusion in the form of Visualizations. The data is vizualized as it becomes easy to analyse data at instant. The Analysis also solve some of the business cases that can directly help the customers finding the Best restaurant in their locality and for the company to grow up and work on the fields they are currently lagging in.
Data Preparation
The Dataset is provided to us by REGex Institute for training purpose. The Data can also be found at Kaggle.
The dataset contains the following features:
Name: This feature contains the name of the restaurant in a city
Price: Contains the approximate cost of meal
Cuisine Category: Consists of different food categories, separated by comma
City: Contains the name of the city the restaurant is located in.
City Region: Contains the neighbourhood in which the restaurant is located
URL: This feature contains the URL of the restaurant on the Zomato website
Cuisine Type: Type of the restaurant
Timing: Opening and closing time of a restaurant.
Rating Type: Ratings in terms of Excellent/Average/Good.
Rating: Contains the overall rating of the restaurant out of 5
Votes: Contains total number of votes for the restaurant
Dataset can be downloaded from the RepositoryData Integration
This step involves integration of all the files containing data for each city into a single file/ data frame. For this, Python’s Pandas, NumPy and Glob libraries have been used.
- Importing the data as Data Frame
- Give the path of Folders Containing CSV Files
- Run the Script to Integrate all files inside a folder
- Export the new CSV File
import pandas as pd
import numpy as np
import os
import glob
all_files = glob.glob(r"C:/..../Input" + "/*.csv")
li = []
for filename in all_files:
df = pd.read_csv(filename, index_col=None, header=0,quotechar=' " '),delimiter="|")
li.append(df.values)
df_np=np.vstack(li)
df1 = pd.DataFrame(df1.values, columns =
["NAME","PRICE","CUSINE_CATEGORY","CITY","REGION","URL","PAGE NO","CUSINE TYPE"
,"TIMING","RATING_TYPE","RATING","VOTES"])
df1.drop(columns = [PAGE NO","URL","TIMING"],axis=1,inplace=True)
df_final.to_csv(r"C:/Users/..../Output.csv",encoding='utf-8', index=False)
Data Cleaning (Pre-processing)
The next step is data cleaning process. This involves deletion of unnecessary and redundant features of the data.
Data Cleaning is the process of ensuring that your data is correct, consistent and useable by identifying any errors or corruptions in the data, correcting or deleting them, or manually processing them as needed to prevent the error from happening again. Data given to us was containing lot of errors like Null values, White Spaces, Hyphen, Latin Letters, Incorrect value. We have used Python Library Pandas for Data Cleaning purpose.
- Importing the data as Data Frame
- Explore the data and check for errors that make data Inefficient for further analysis
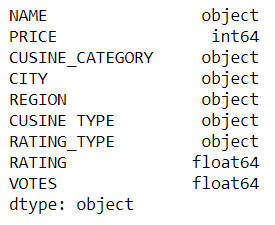
- Check the datatype and convert as per requirement
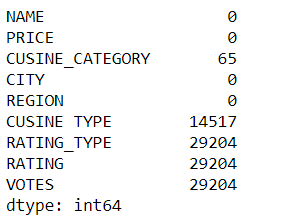
- Check for Null Values and the custom Null
- Replace or Drop Null values, Replace the Null values using Mean taking Groupby.
- Export the data
For data analysis, we do not need the contact details of the restaurant so, the URL column is removed along with the Page Number column which is also of no use for the analysis.
The Null or Garbage values in Rating and Votes column are filled using Mean of the hotels grouping by City and Cuisine Type.
Moreover, the timing column is not providing any additional information which may be used for the analysis since only the opening and closing time of the restaurant is specified so, this column is removed as well.
df = pd.read_csv(r"C:\....\InputFile.csv")
df['RATING'] = pd.to_numeric(df['RATING'],errors='coerce')
df['VOTES'] = pd.to_numeric(df['VOTES'],errors='coerce')
df_final=(df1.set_index(df1.columns.drop('CUSINE_CATEGORY',1).tolist())
.CUSINE_CATEGORY.str.split(',', expand=True)
.stack()
.reset_index()
.rename(columns={0:'CUSINE_CATEGORY'})
.loc[:, df1.columns]
)
missing_values = ["none","NEW","Not rated","None",np.nan])
df = pd.read_csv(r"C:\....\InputFile.csv" , na_values = missing_values)
df.isnull().sum()
df['RATING'] = df['RATING'].fillna(df.groupby(['CITY','CUSINE TYPE'])['RATING'].transform('mean'))
df['VOTES'] = df['VOTES'].fillna(df.groupby('CITY','CUSINE TYPE')['VOTES'].transform('mean'))
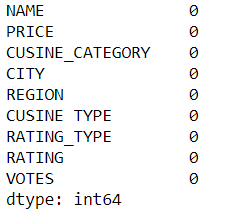
df = df.dropna()
df.isnull().sum()
df.to_csv(r"C:\....\Output.csv",encoding='utf-8', index=False)
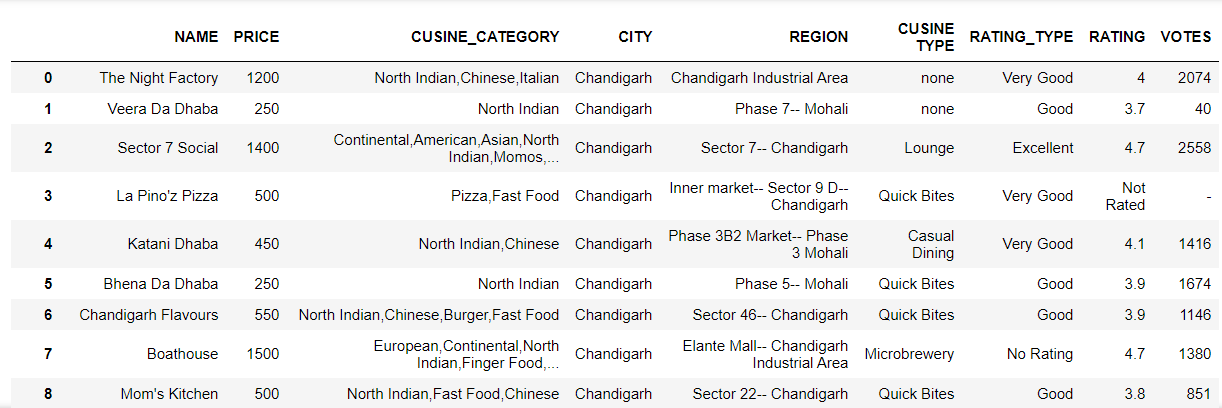
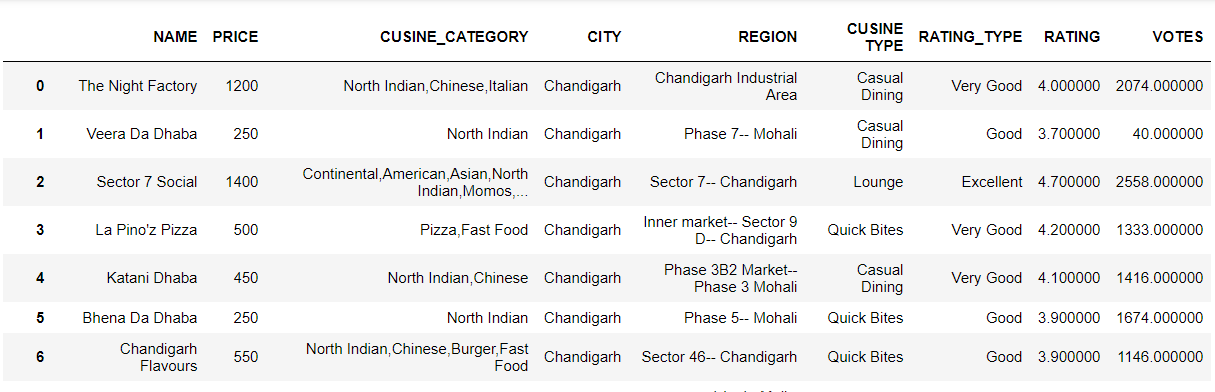
Now that the data has been cleaned, the final data set looks like this:
Data Visualization
Business Case-1: Check the Cuisines and their Ratings Served by a restaurant in a Region of selected City
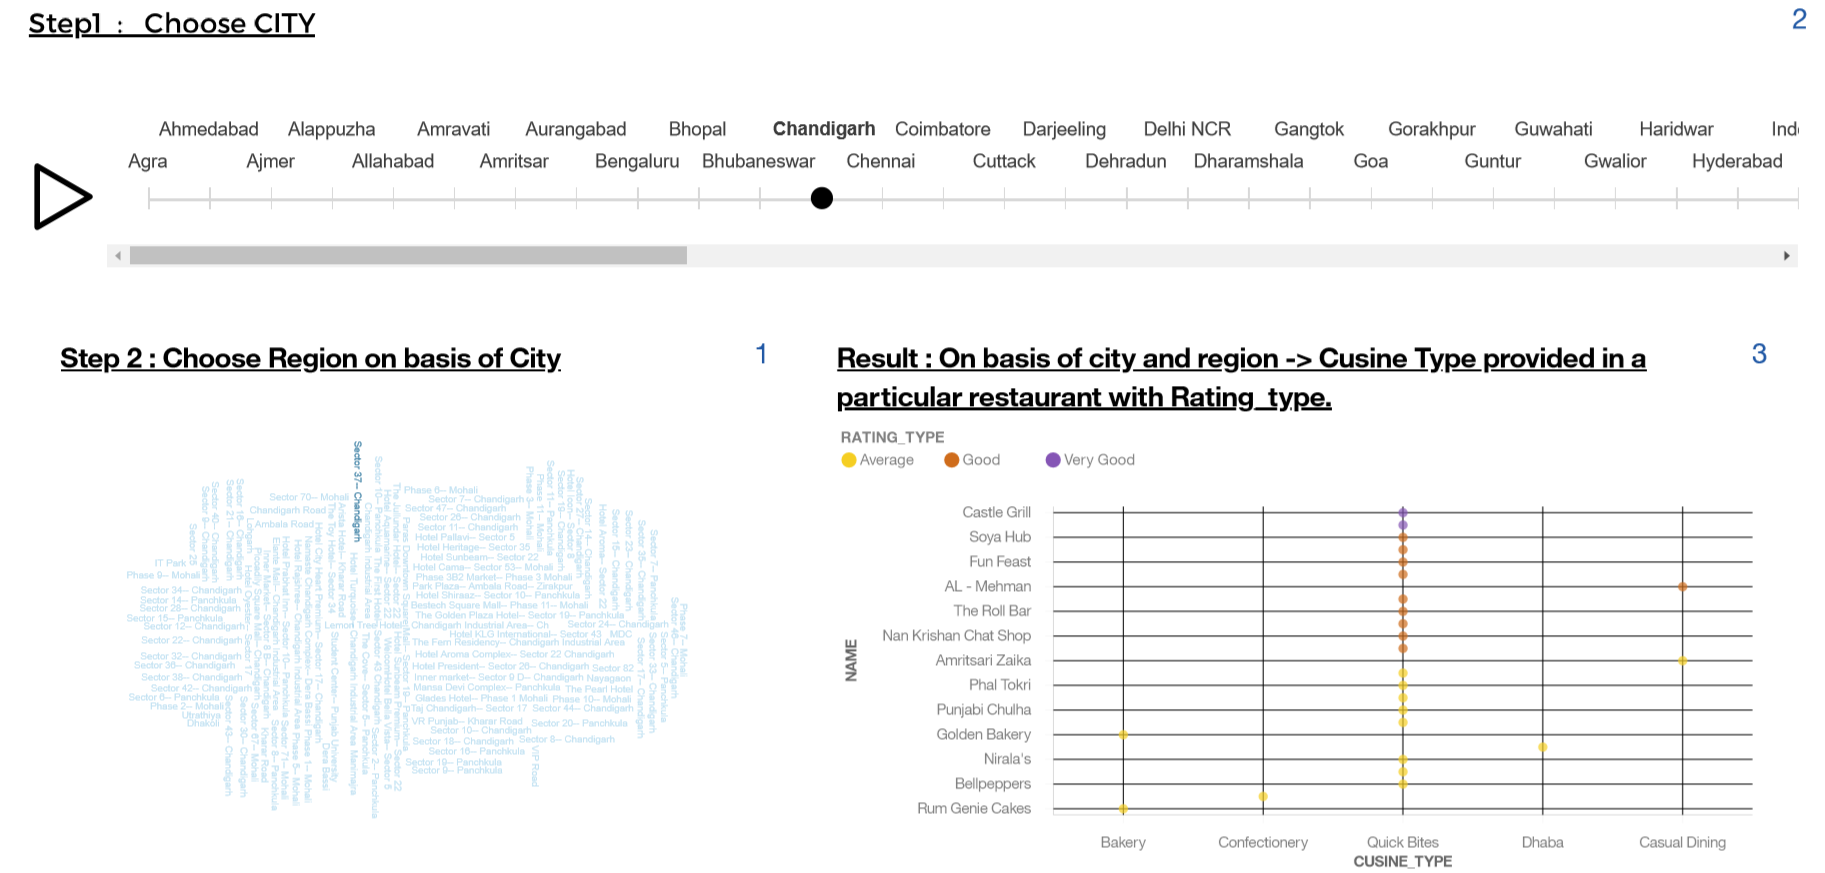
The graph prompts the user to select the city and then the region to show the plotted data. It Shows the Restaurants in a particular region of selected City, the Rating of that restaurant and the type of the Cuisine of that restaurant. This can be useful when a user wants to find restaurant in the region and check the restaurants of particular Cuisine with the Best Rating.
Business Case-2: Check the average rating of Restaurants in a Region of a City and its Average Price
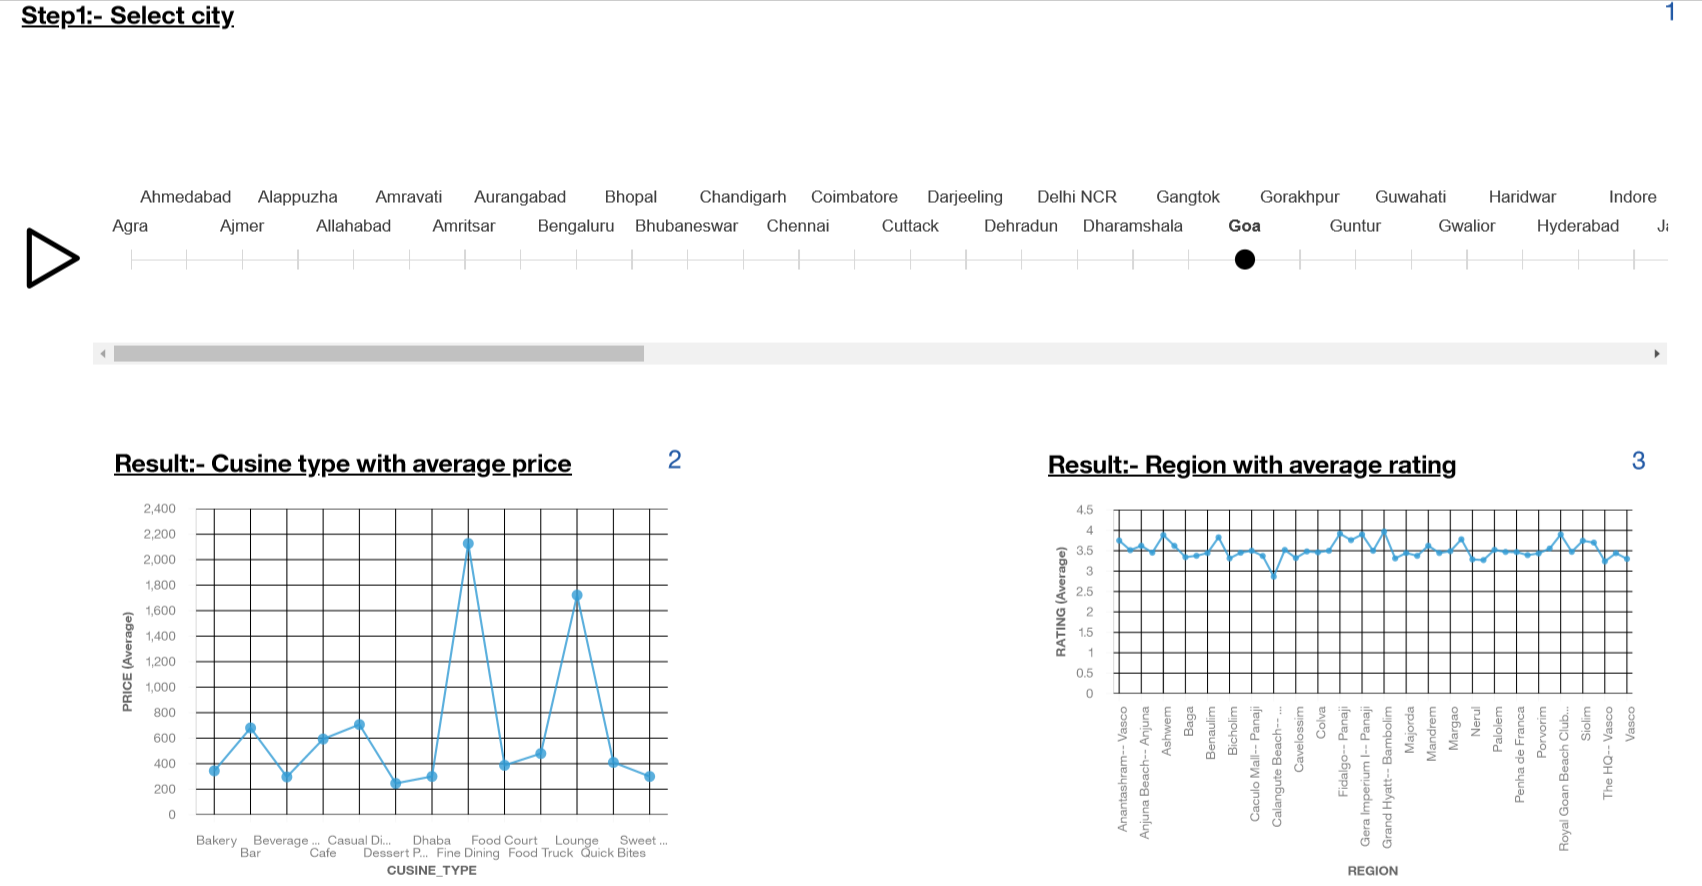
Visualization show the Cuisine Type vs Price and Region vs Rating graph, User can select the City first and can analyse the Cuisine types in a city and the Average price of that Cuisine this could be helpful for users visiting new cities finding the best cuisines in the city with average price of that cuisine type. Also they can find the Restaurants Rating wise, They can find the region with Rating of restaurants in that region.
Business Case-3: Number of Restaurants in a Region of a City
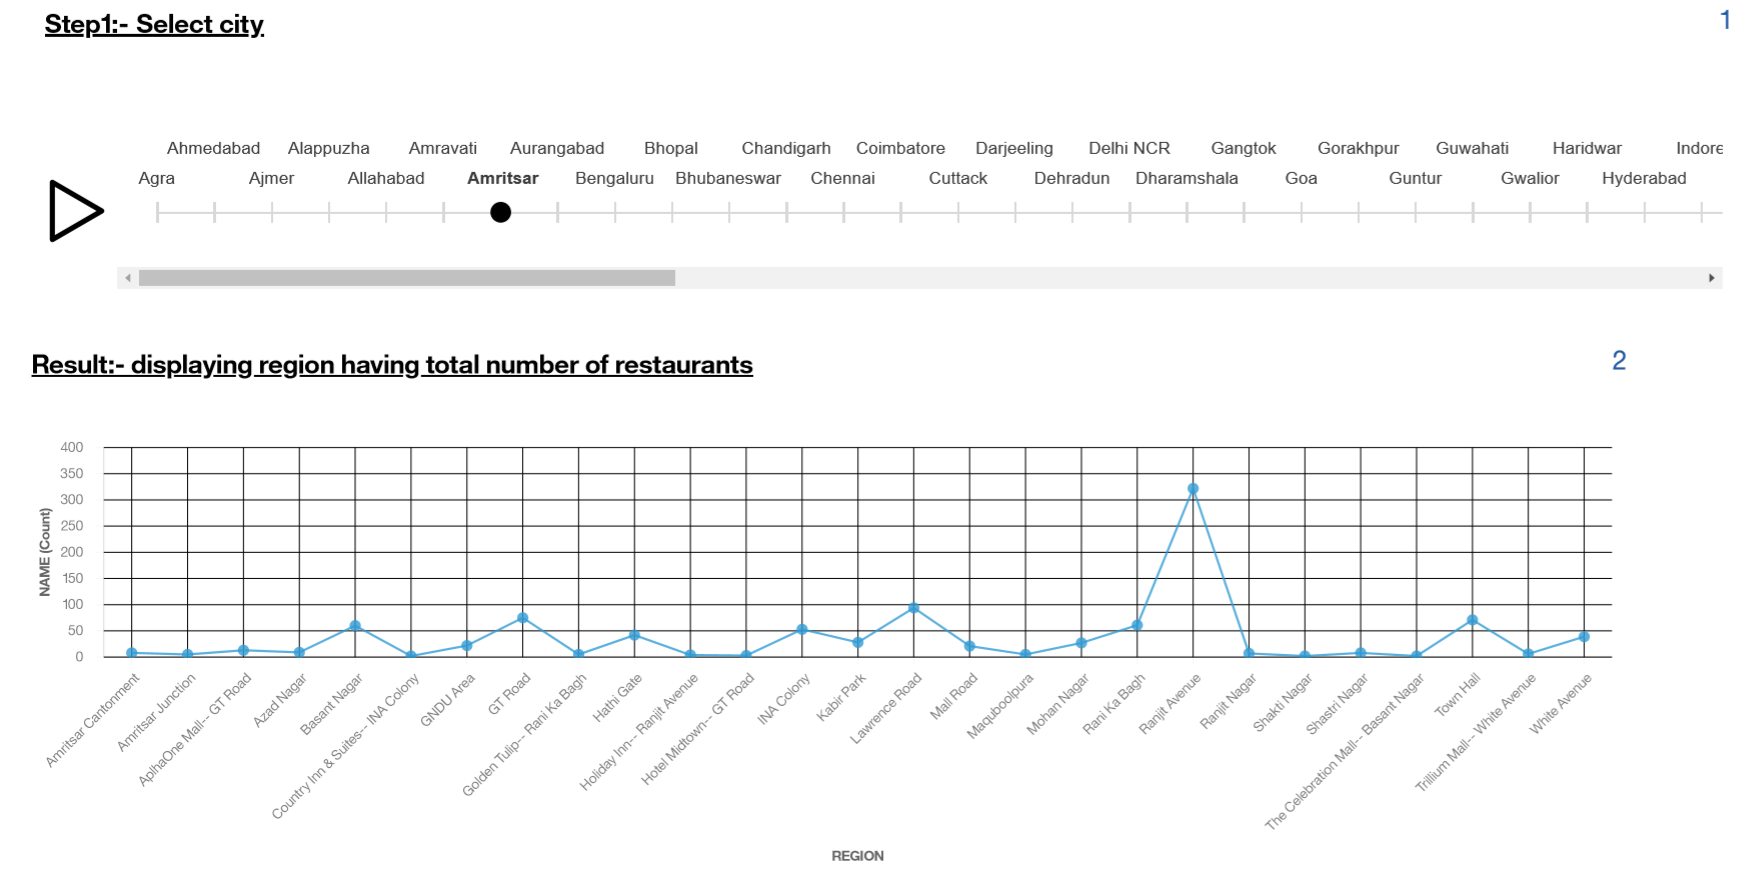
Data is represented showing Number of restaurants in a particular Region of a selected City. User can select a city of which he wishes to find the number of restaurants in the regions of that city. The Company Zomato can figure out in which city it has minimum number of Tie ups with restaurants and after analysing they can expand their business also by analysing the city regions they can also find the regions where they need to put efforts.
Business Case-4: Search for Restaurant in particular Region of a Selected city, can also check the Rating
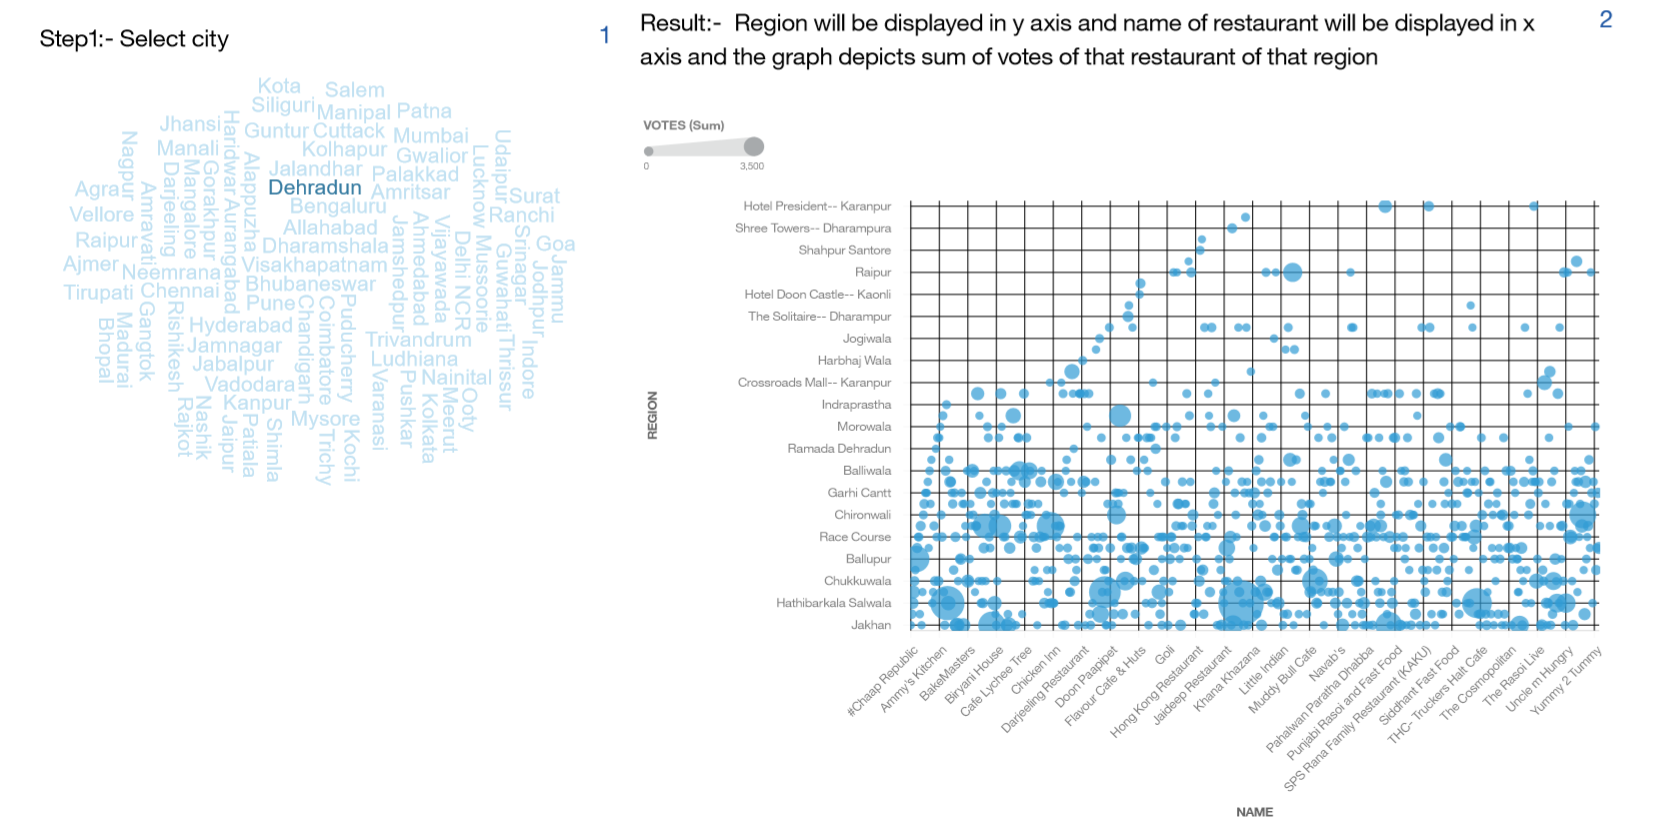
The Scatter plot shows the Restaurant Votes in a region of a City, User can select the city and then can compare the restaurants based on Votes, He can check the available restaurants in the particular region and then can see the votes of restaurants present in that region. Also it becomes easy to find the best restaurants by looking at the votes a restaurant have and the number of restaurants present in a region.
Business Case-5: Find Cuisine offered by Restaurants in a City
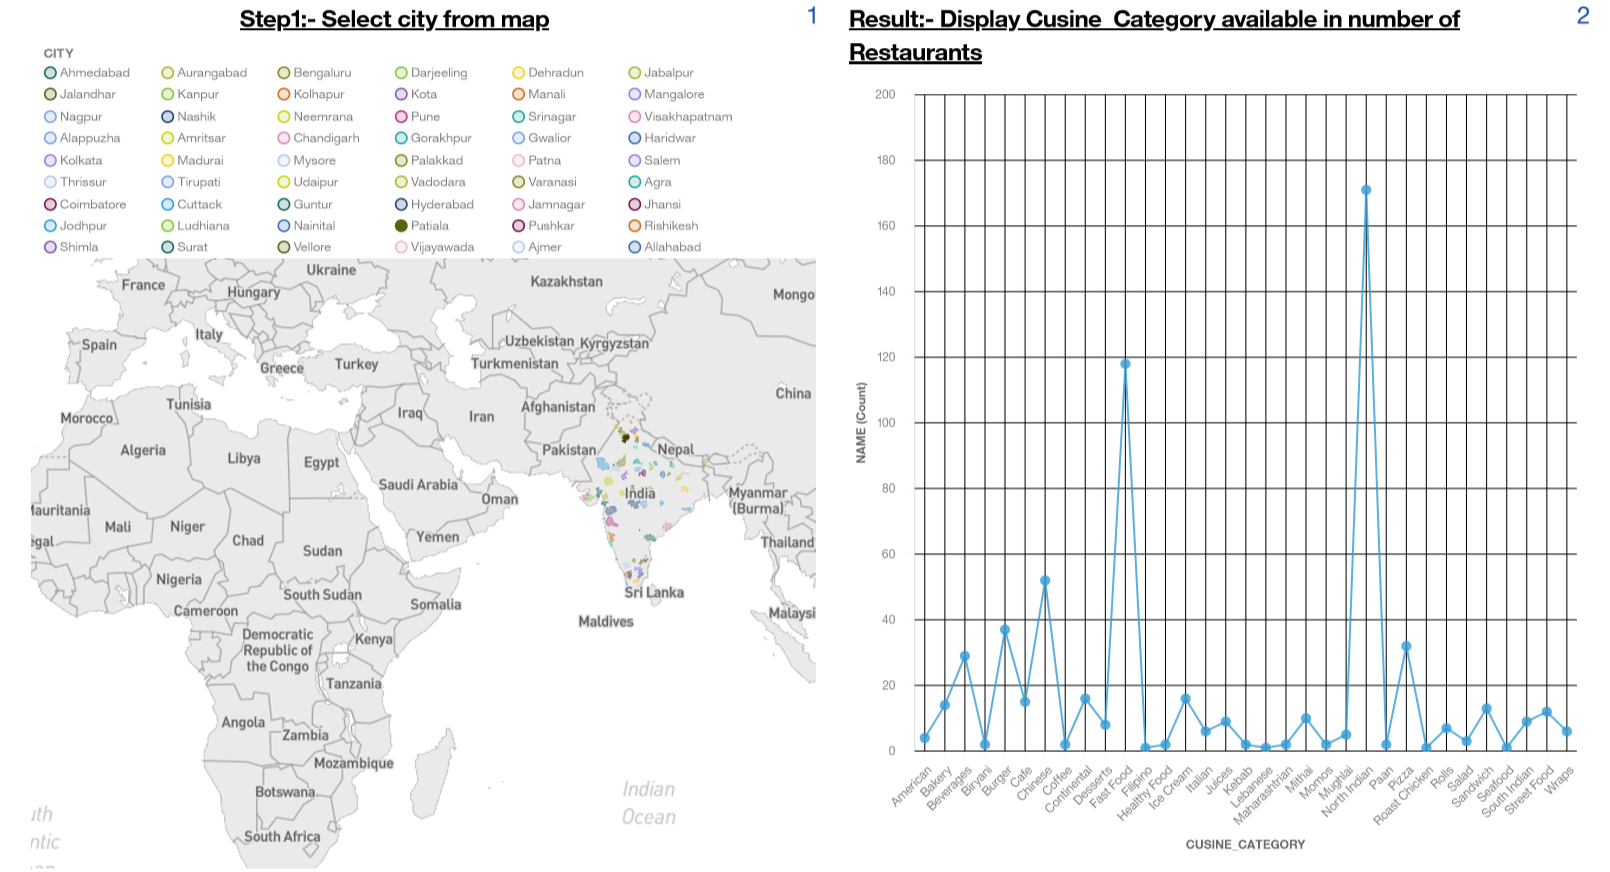
The map shows cities having restaurants tie up with Zomato, On selection the city it shows The types of cuisines served in the city, also a User can find the number of restaurants serving the cuisine, On analysing we can find the Best Cuisine in a City, Zomato can use this data to maximise the demand of that cuisine and focus more on that cuisine. Also people visiting different cities can search for Cuisines served in a city and the best Cuisine in that particular city.
Business Case-6: Different Cuisine Types and their Average Rating shown on Map
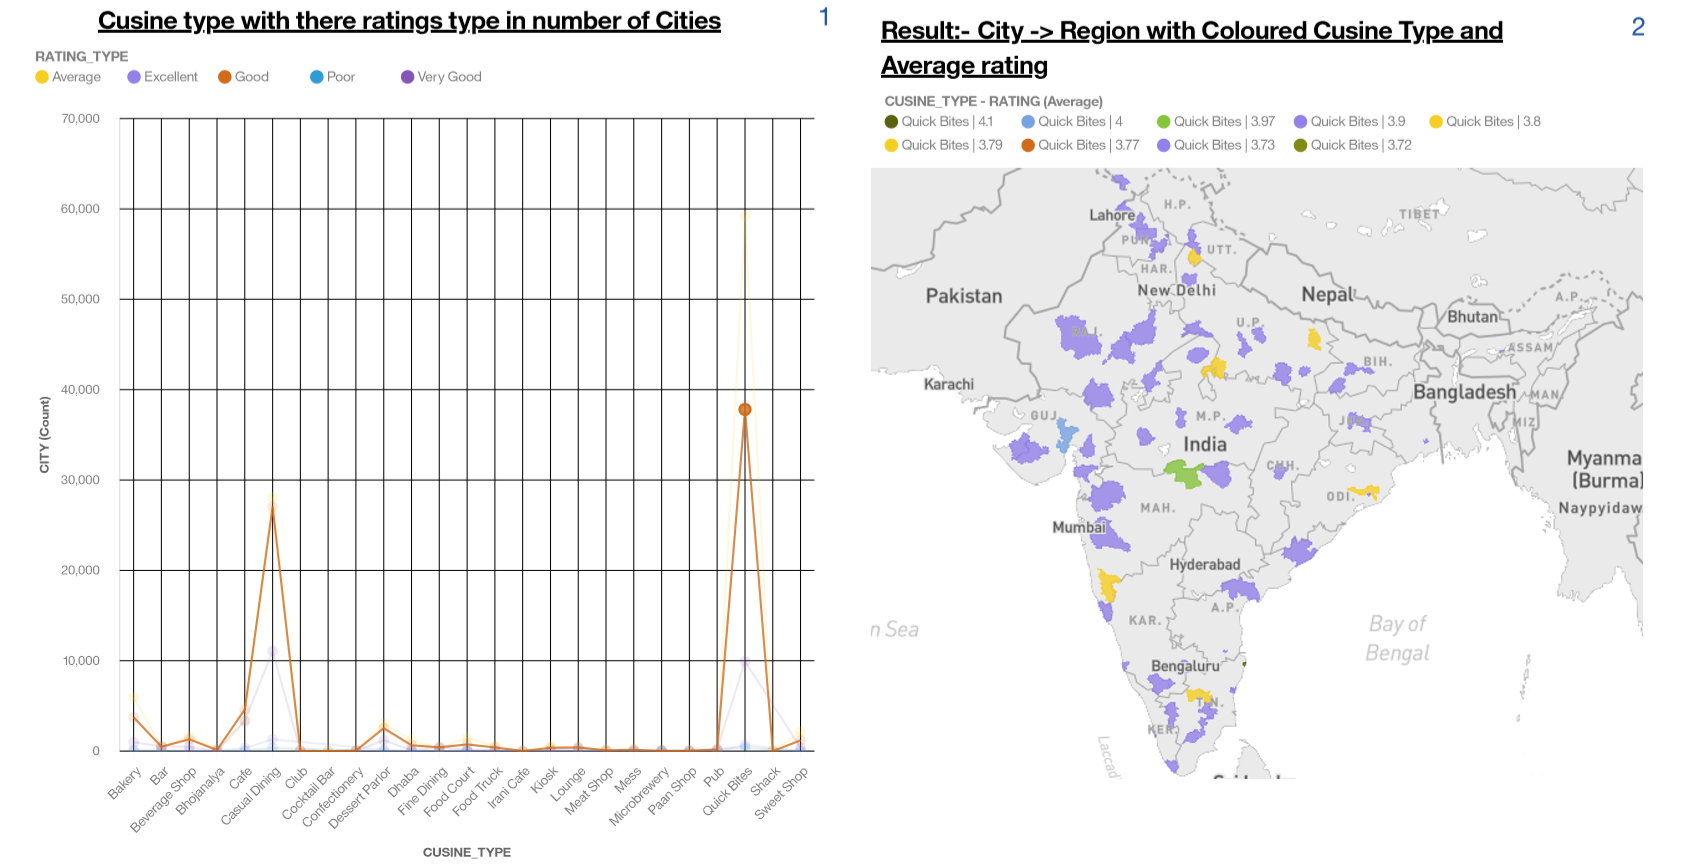
The plotting on the map shows different Cuisine Types and their Rating, The number of cuisine types available can be useful when finding the Highest number of cuisines.
IBM ID- zomato1project@gmail.com
PASSWORD- Zomato1234
Conclusion
From this data processing, we can get this following conclusion: There are 105624 restaurants registered on Zomato Apps based in India. Almost 18% of registered restaurants in India are located at New Delhi (19611 restaurants), 13% in Mumbai (14026 restaurants), 7% in Bengaluru (8507 restaurants). 1080 Restaurants in India having Excellent rating type. 11695 Restaurants having Very Good as Rating Type and 336 with Poor Rating. 104 Restaurants having rating above 4.8 and 84 above 4.5. 55462 Restaurants as Quick Bites, 25388 Restaurants having Casual Dining, 5982 as Bakery, 4523 are Cafe. Price range in India Restaurants is very cheap to Expensive. Average cost for two people eats in restaurants (417 Indian Rupees). Over than 30000 restaurants in India is not voted yet by Zomato users. India restaurants has an average-service rated by users. North Indian food, Chinese food, and Fast food is the most favourite cuisine in India. Sheesh Mahal-Virasat Heritage Restaurant in Jaipur Rajasthan and The Theatre Club & Lounge - Radisson Blu in Delhi NCR being the most Expensive with a Price of 6000 Indian Rupees. Bawarchi Restaurant in Hyderabad being the most Voted restaurant with a 41344 votes.